Google Analytics 4 Is Replacing Universal Analytics In 2023!
The moment has arrived. Google Analytics 4 (GA4) is now available and ready for use. Actually, GA4 has arrived and is prepared to take over.
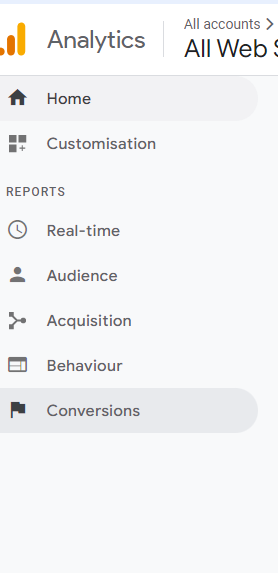
Google Analytics 4 and Universal Analytics information is still widely available and read. Though it appears like GA4 has more user data, UA really contains the same data, it’s simply concealed under the “Audience” panel.
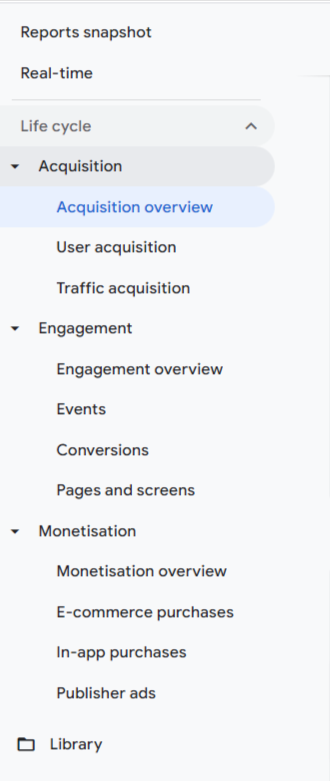
GA4 used for “engagement” , “monetization” and the addition of “retention” are the main differences.
Behavior has been replaced by engagement, however the additional conversion report still covers many of the same topics (formerly “Goals”).
As we previously indicated, over the past ten years there has been an increase in interest in keeping consumers and converting them into advocates. In order to emphasise the significance of retention, Google has openly included a section on it to its lifecycle report.
Types of Metrics in GA4
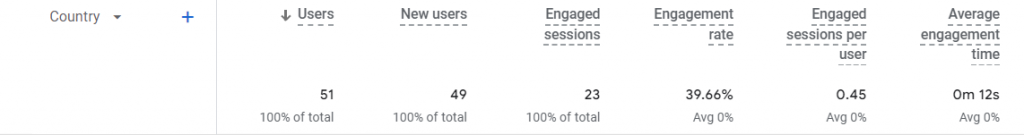
1. Acquisition metrics
The Acquisition reports give details about the source of your traffic.

A) New users: The total number of users that used your website or app for the first time.
B) Engaged sessions: Total number of GA4 sessions that lasted at least ten seconds, saw at least one conversion, or had at least two page visits are considered engaged sessions.
C) Engagement rate: The percentage of engaged sessions is known as the engagement rate. It is computed as sessions/engaged sessions.
D) Engaged sessions per user: Average number of active sessions per user – This is the figure for active sessions per user.
E) Average engagement time: The average amount of time that a website or app was focused in the browser is the fifth factor, average engagement time.
F) Event count: The total number of times an event (or events) was triggered.
2. Engagement metrics
User engagement measures how long your app or website was in focus.
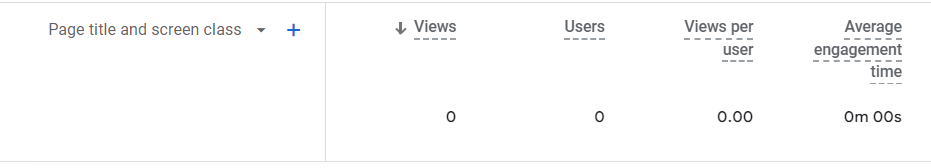
A) Views- The total number of times a user has browsed a webpage or an app screen. Unique views are not reported by this statistic. This metric is calculated by adding screen_view events and page_view events.
B) Users- The total number of unique users who interacted with your website/app for any non-zero amount of time. This metric is calculated as: Count distinct users where engagement_time_msec parameter > 0.
C) New users- The total number of users who interacted with your website/app for the first time. This metric is calculated as Count distinct users where event name first_open or first_visit
D) Views per user- It is the average number of screens viewed by each user. This metric is calculated as engaged sessions/users.
E) Average engagement time- It is the average length of time that the website/app had focused in the browser.
3. Monetization metrics
Monetization reports show revenue from items, ads, and subscriptions on your site or app.
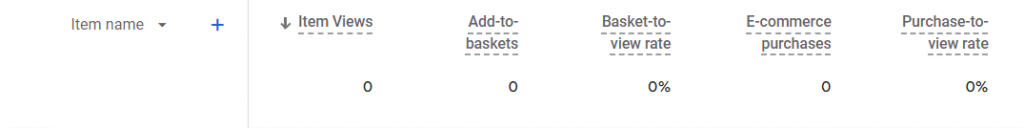
A) Item views- It is the total number of times the item list was viewed.
B) Add to carts-It is the total number of times users added items to their shopping carts.
C) Cart-to-view rate- It is the ratio of ‘add to carts’to ‘product views’.
D) E commerce purchase- It is the total number of times users completed a purchase.
4. Retention metrics
Retention tells you how often and how long users use your website or mobile app after their first visit.
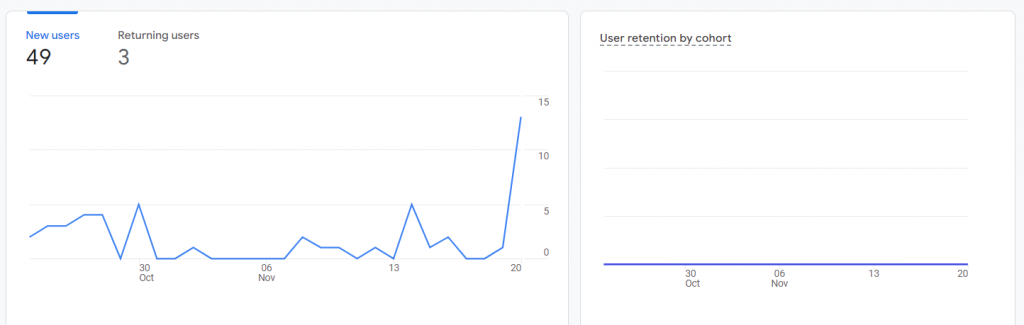
A) New users- The total number of users who interacted with your website/app for the first time.
B) Returning users- The total number of users who have started at least one previous session.
C) User retention by cohort- It is the percentage of the new-user cohort on charted date who return
each day.
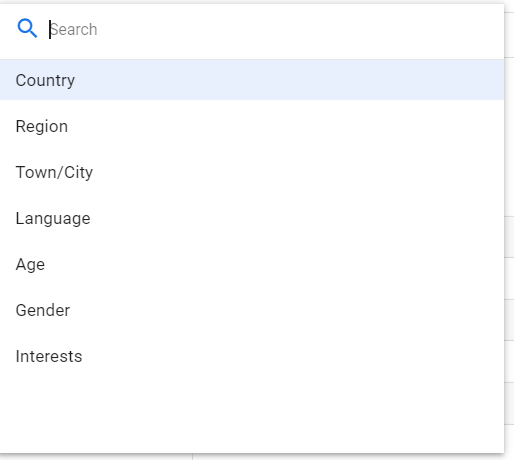
5. Demographics metrics
Demographics helps you classify users by age, location, language, gender, and online browsing and purchasing interests.
The demographics metrics are the metrics that are used to measure the characteristics of a demographics dimension. For example: country, region, town/city, language, age, gender and interests.
More detailed info can refer to Google Analytics Official Site.
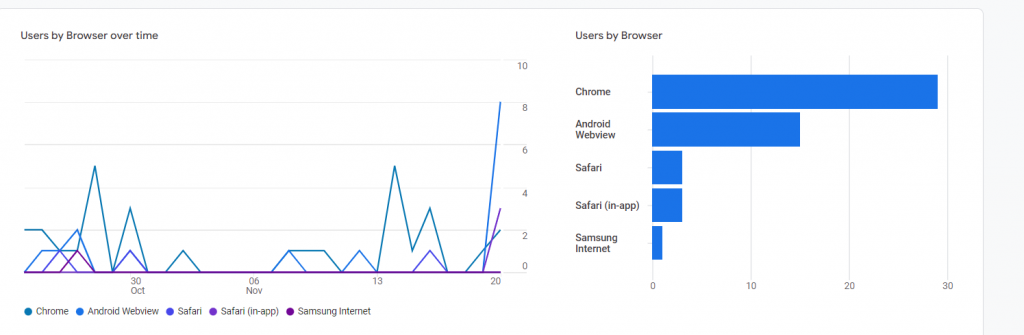
6. Tech metrics
The tech metrics are the metrics that are used to measure the characteristics of a tech dimension such as Chrome, Safari, Edge, Firefox, Samsung Internet or Android App View.
More detailed info can refer to Google Analytics Official Site.
Share This Blog:
![]()
![]()